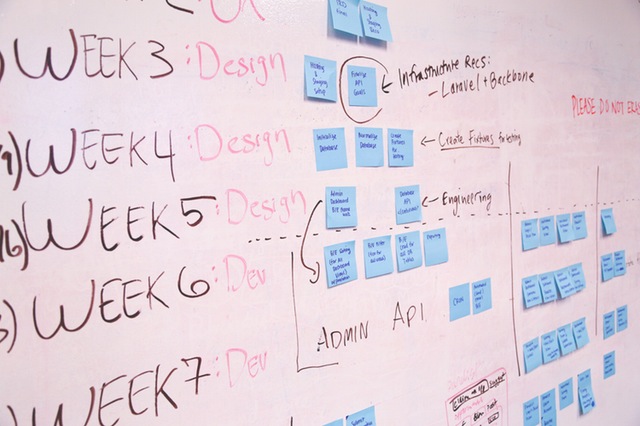
What are the best practices to grow a tech startup from garage project to international success?
The field of product growth is focused on maximising customer success by improving your onboarding, retention, and upsell processes. Growth teams are becoming a standard presence at many Silicon Valley companies, including Facebook, Hubspot, Atlassian, Uber and Slack. But as this 2017 Harvard Business Review article points out, growth as a discipline is still a relatively recent concept outside of the Valley. Growth can be divided into:
- Growth marketing/hacking for acquiring new users
- Product growth for developing successful customers
While growth marketing techniques like paid acquisition and SEM/SEO are well-established, the move towards dedicated ‘product growth’ engineering teams is relatively new territory. So what does product growth look like in 2016? This guide lays out popular growth practices and infrastructure recommendations by company stage. The tools should be applicable to most Software as a Service companies with self-service and/or enterprise pricing.
Stage 1: Pre-Revenue Startup
0-1 employees / Bootstrapped
Recommended Infrastructure
CRM – A basic sales management tool such as Hubspot or Salesforce.
Website Analytics – Setup Google Analytics and optionally MixPanel or KISSMetrics.
Social Media – A basic WordPress blog or similar static site, email newsletter such as Campaign Monitor, and social media tools.
Live Chat – Facilitate your customer discovery by making it easy for prospects to talk to you in their preferred channel, whether social network, Slack or online. Engage your website visitors with a tool such as Hubspot chat or Drift.
Recommended Processes
Customer Interviews – Direct customer interviews via email, social media, phone calls and in-person meetings are the most useful way to chase early customers.
Stage 2: Reproducible Sales
1-15 Employees / Seed Round
Recommended Infrastructure
Marketing Automation – The marketing platform should be able to manage lead attribution, email campaigns, custom landing pages and forms. Consider Hubspot or Marketo.
Business Intelligence Tools – Used for producing business reports and data mining. Consider Google Analytics and Chart.io.
User Metrics – An analytics tool such as Segment to ingest customer activity.
Recommended Processes
Lead Attribution – The marketing automation platform should track multi-touch attribution for paid and social campaigns.
Incremental Signup – The user signup process should only ask for the minimum information to verify a new user’s account, and depending on your product economics, visitors should have the ability to trial some or all of the product without even signing up. Users can then be incrementally asked to provide details as part of their onboarding process, after they have a chance to start actually using the product and seeing value. For example, anonymous users can be prompted to sign in to save their changes, or to add a credit card in order to use late-stage onboarding features. Your onboarding strategy may benefit from offering a free product tier, or a live, public demonstration application. This approach brings users to your ‘aha’ moment sooner, and is used even at companies like the Stripe payment platform, which allows users to start accepting credit card payments without an email address or password.
Lead Scoring – Sales leads data should be scored from user metadata, in-app behavior and third-party lead enrichment. For example, an anonymous GMail user who rapidly invites 5 additional users and starts using team-level functionality may be worth flagging to the sales team.
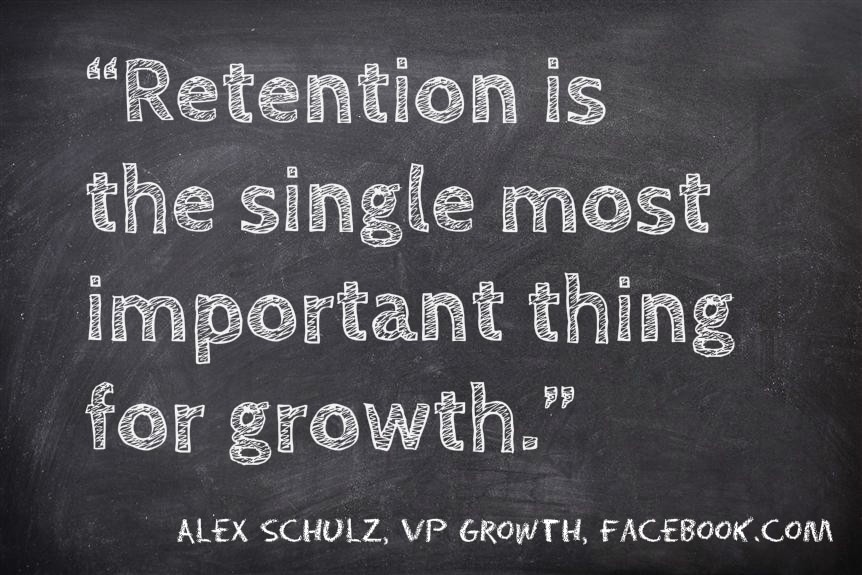
Retention Before Growth – A common startup mistake is to focus on new customer development while customer churn is still high. For example, a fast-growing startup may retain 95% of their paying customers each month, but this still equates to 46% of customers leaving every year. If customer churn is above roughly 8% annually by revenue, then the product roadmap should focus on improving retention until it declines to 5-7% annually.
Stage 3: Product / Market Fit
15-100 Employees / Series A
Recommended Infrastructure 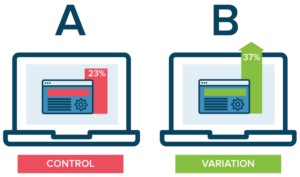
A/B & Multivariate Testing – The ability to experiment with different site designs and customer messaging becomes easier once your website has at least 20,000 visitors a month. Consider Optimizely or KISSmetrics.
Custom Landing Pages – Content marketing should be at the stage of creating custom landing pages for major campaigns. Experiment with custom content for different customer verticals, personas and use cases.
Data Warehouse – A comprehensive data store for all low-level customer activity. High-level business intelligence dashboards can be built directly ito your warehouse or tracked in your CRM/marketing automation. Start tracking data early for later analysis. Consider Amazon Redshift or Google BigQuery for a dedicated warehouse tool.
Recommended Processes
‘One Metric That Matters’ – Identify a single behavior that correlates strongly with customer success, and focus your company efforts on building towards that. For example, Facebook’s one metric of user success was whether a new user added 7 friends within 10 days.
CAC & LTV Metrics – Marketing automation should be configured to estimate customer lifetime value (LTV) and cost of customer acquisition (CAC) based on revenue modelling.
Customer Personas – Map out 4-8 core customer personas using real customers and build a set of workflows for each persona. These personas should inform your user stories and can be mapped to determine how these personas are represented across your user base.
Cross-Sell & Upsell Campaigns – Your team should be able to analyse existing customer purchases to predict the most likely future purchase based on product usage. This can be use to develop specific cross-sell and upsell campaigns. For example, an Atlassian customer who has already purchased the JIRA project management tool and Confluence wiki is most likely to be interested in the Bamboo CI server for their next product.

Funnel Cohort Analysis – Track improvements to your customer funnel by tracking the timestamp at which each customer undertakes an activity in your funnel, then tracking how many days since their signup date that it took them to complete each step. Ideally, customers should be completing onboarding tasks more quickly as you improve. This dashboard can be setup in a business intelligence tool such as Tableau and/or as a table in the data warehouse.
Exit Surveys These provide an easy way to track self-reported reasons why customers are abandoning your product. Adding a short ‘Why did you cancel your account?’ field to your account deletion page, and a one-field survey link in your deletion confirmation email, will later help you identify common themes, failure points, and interesting users for followup. A single field-survey design has the highest chance of completion, and your marketing automation tool can customize the exit email to thank users who already completed the online version. Enterprise channels should be conducting manual customer exit interviews and storing the results as either custom fields in your CRM or in a online form, so that both self-service and enterprise results can be viewed together in your data warehouse.
Churn Analysis & Followup – In-app behavior can identify a range of predictive and trailing indicators of churn, such as disabling an integration or decreasing visit frequency. You can track these in a marketing automation tool to trigger custom in-app and marketing messages or create various ‘at risk’ account flags in your CRM. It’s worthwhile tracking your messaging effectiveness experimentally to avoid ineffective messages, and to look for predictive indicators that show up before the customer actually makes a decision. This is best combined with direct customer conversations to determine their internal though process and timeline, then comparing this to your trackable in-app behavior to identify statistically significant early warning signs. You can then setup your CRM with a health score for each account plus actionable behavior flags such as ‘Only 30% of accounts logged in this past week’ or ‘Has never created a report’ to help guide their conversations.
Cross-Disciplinary Growth Focus – Engineering resources for building growth infrastructure can usually be built within the existing marketing, application engineering and data/business operations teams.
Business Dashboards – Make critical business metrics visible
to the rest of the company using live dashboards. If non-sensitive,
these metrics can be great motivators for displaying around
the office. Consider using BI tools like Chart.io or Tableau.
Stage 4: Market Expansion
100-250 Employees / Series B Funding
Recommended Infrastructure
In-App Messaging – Enable two-way communication between your SaaS application and end users for custom onboarding flows and use case-based messaging. End users can respond to prompts and information delivered while using the application to confirm or opt out of particular use cases. For example, a Heroku user who is flagged as building a mobile backend can be sent specific guides to building mobile applications. Consider using Intercom.io, Customer.io, or developing an in-house solution.
Feature Flag Deployments – A great development feature used for continuous delivery is to enable and disable new functionality using feature flags. This makes experiments easier to revert and can provide base functionality for in-app experimentation. Consider LaunchDarkly or in-house tooling.
Recommended Processes
Growth Team – Consider spinning up a dedicated growth team with engineers able to ship new in-app functionality. Responsibility for the customer funnel and underlying infrastructure is generally shared between marketing and growth teams, with growth team usually taking ownership of the funnel from the point of user signup onward. The growth team is generally a part of either application engineering, or the data/BI team. A growth team sits at the intersection of engineering, marketing, and BI/data analysis.
Machine Learning Expertise – Consider spinning up a machine learning team to help generating more complex insights into customer behavior. This may be assigned to the growth or BI/data analysis teams.
Net Promoter Score – This customer success metric is used by companies like Slack to assess the subjective product experience, by asking customers to score your product between 1 and 10 based on how likely they are to recommend the product to a friend or colleague. Tracking NPS changes over time provides useful directional feedback. Consider implementing into customer satisfaction surveys, or asking directly in-app via a tool such as Marketo or Customer.io.

Win/Loss Analysis – Product managers are often brought onboard during enterprise sales to help evaluate customer requirements, or to support a key sale. This can often position them for the role of an impartial reviewer in a win/loss interview after the sales process concludes. Identifying the real reasons why a sale succeed or failed can be difficult, but often produces great product input.
Customer Lifecycle Nurturing – Expand the onboarding process and email nurture to provide tailored customer journey based on their persona and use cases. For example, an Atlassian customer who signed up for the JIRA project management tool via a campaign relating to the Scrum development methodology can be opted into a ‘Scrum’ use-case. This can be used to customize email campaigns, the onboarding wizard and in-application content.
Customer Feature Usage Report – The data warehouse should be setup with a date-based usage report that lists all users and how many times they have used each major product feature during a given period. This is often daily but may be weekly for easier processing. Feature usage should also be aggregated at the account level.
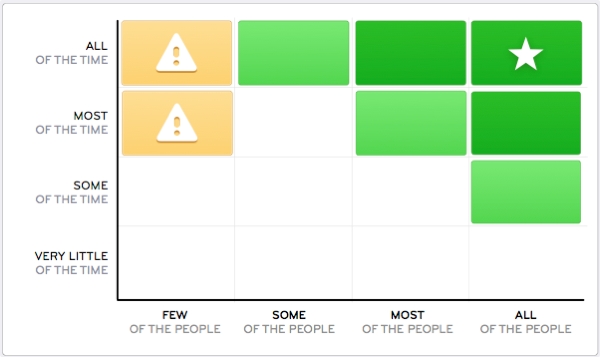
Feature Usage Quadrant – This diagram evaluates features based on their popularity and frequency of use. It can help to prevent overinvestment in low-value features, and quantify how much of the product roadmap is allocated towards enterprise users.
Stage 5: Market Leader
250+ Employees / Series C Funding onwards
Recommended Infrastructure
Multi-Channel User Communication – The ability to message a user via the most appropriate method for that user and message type. Website users may be also using the product via email, chatbot, and mobile or desktop application. If you are building a tool for software developers, they may be using a CLI, API or IDE. For example, a customer’s product usage may trigger a generic upsell notification. The multi-channel communication platform can customize the upsell message based on the customer persona and decide to deliver it to the administrative user via both email notification and in-app upsell wizard. Consider Salesforce Marketing Cloud, Eloqua or building in-house.
In-App Experiments – The ability to experiment with different experiences for your users. Instead of immediately rolling new features out to the all users, these are tested individually on a subset of users, for example by opting in 1% of users for a month. This evolution of ‘Feature Flag’ development makes it possible to track the impact of each application change your user metrics. At high scale, users may be opted in to multiple experiments simultaneously.
Recommended Processes
Customer Intention Flow – Research the most likely steps that each customer persona should undertake from signup to becoming an ideal customer. The customer messaging flow should communicate next steps for successful users, while also covering responses to users who encounter known errors or stop engaging with the product.
Expected Adoption Metrics – Product roadmap planning can be supported by expected outcomes across the userbase and target personas. For example, if a product team proposes to improve the reporting functionality with a new report type specifically for their finance users, then the adoption metrics should reflect this:
- 30% of finance users create at least on one report of this new type
- 15% of finance users view that report at least once a week for the first 6 weeks
This requires that the data warehouse can report dates at which customers have used a feature.
Named Customer Champions – Product
managers should be recruiting customers who can beta test and champion
each major feature on their product roadmap. Applying real-life
people to development stories can also help to motivate the team.
The business intelligence tool can be configured with a date-based
feature frequency report that lists users and history of how often they
have undertaken a behavior each day or week since signup. This makes it
easy to determine a spread of heavy, light and non-users for each
proposed feature.